


Real Analytics-DA-201 dumps - Real Salesforce dumps PDF in here [Nov-2025]
Realistic ValidExam Analytics-DA-201 Dumps PDF - 100% Passing Guarantee
NEW QUESTION # 90
You have the following view.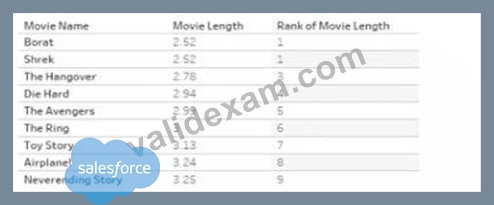
You want to filter the view lo show only records that have a movie name starting with the word. "The". You must achieve the goal without writing any formulas.
Which type of filter should you use?
- A. Top
- B. General
- C. Condition
- D. Wildcard
Answer: D
NEW QUESTION # 91
You want to create the following dashboard.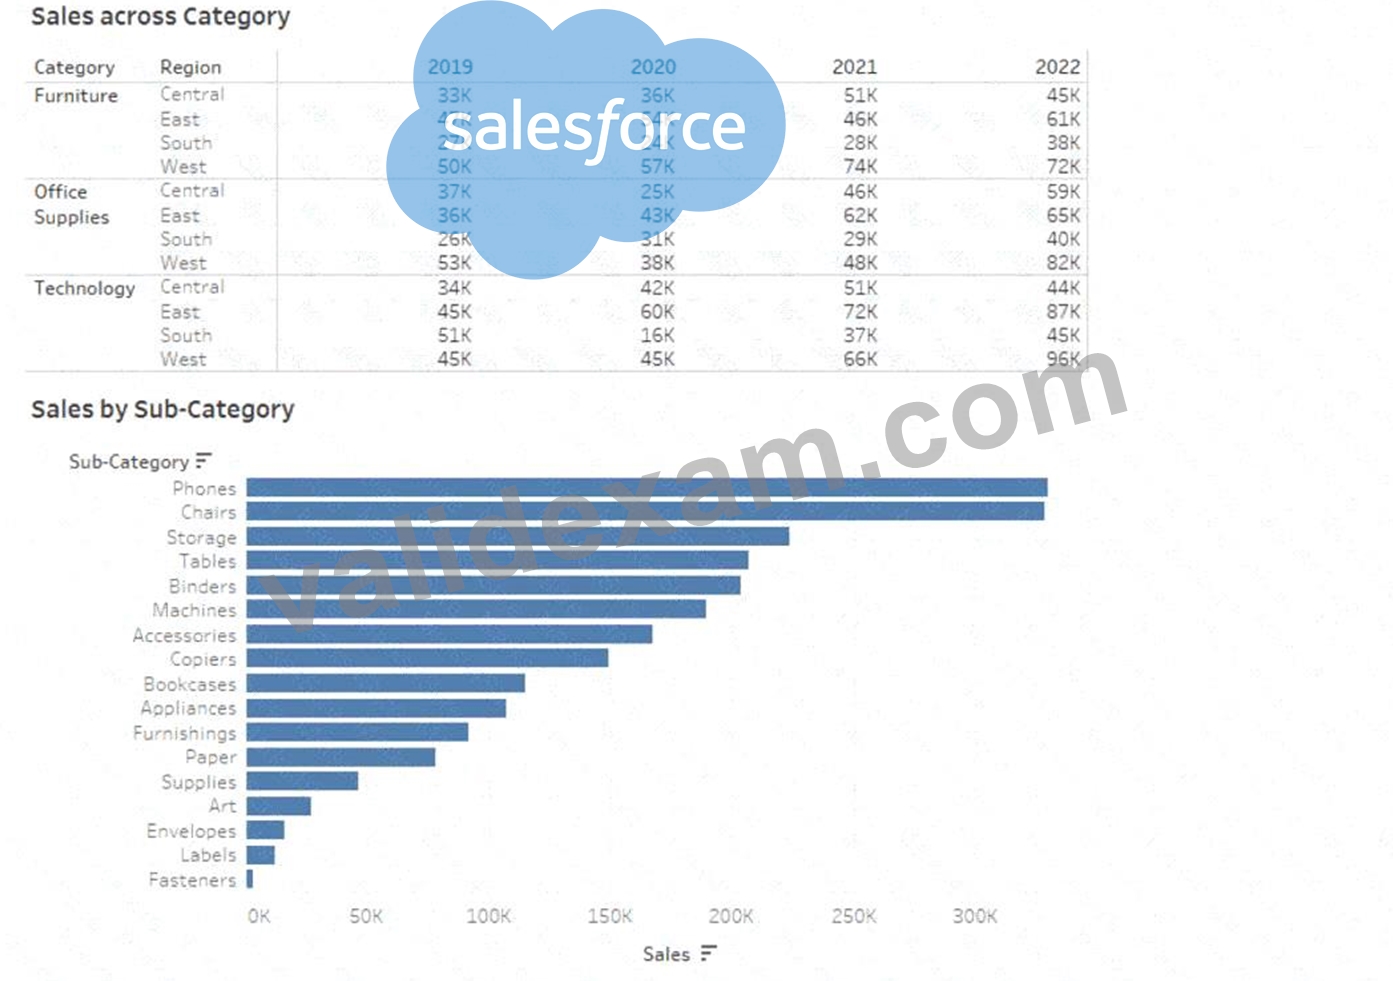
The dashboard will contain two sheets that will connect to the same data source. The top sheet will be configured to filter the bottom sheet.
When you click a category on the top sheet, the sheets must resize as shown in the following exhibit.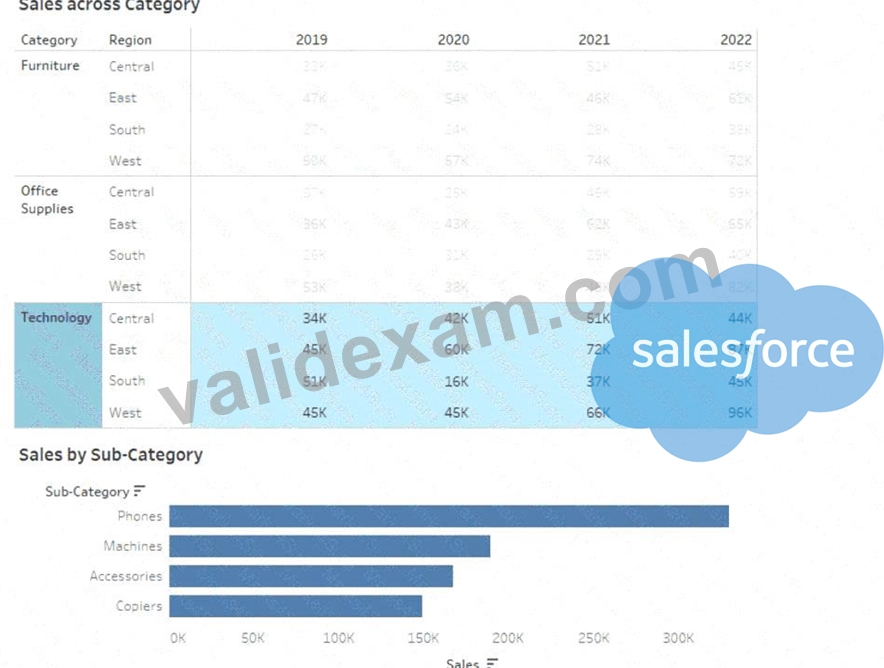
How should you lay out the objects on the dashboard?
- A. Drag a horizontal container to the dashboard and add both sheets to the container. Set the Fit to Standard.
- B. Add both sheets to the dashboard. Set Fit to Fix width.
- C. Drag a blank object to the dashboard and add both sheets to the dashboard. Set Fit to Entire view.
- D. Drag a vertical container to the dashboard and add both sheets to the container. Set Fit to Entire view.
Answer: D
Explanation:
To create the dashboard as shown in the image, you need to use a vertical layout container that will adjust the height of the sheets according to the window size. You also need to set the Fit to Entire view option for both sheets so that they will resize proportionally when you click a category on the top sheet. This way, you can achieve the desired effect of having the bottom sheet expand to fill the space left by the top sheet when it filters out some categories. References:
* Size and Lay Out Your Dashboard - Tableau
* Create a Dashboard - Tableau
* Format Dashboard Layout in Tableau - GeeksforGeeks
NEW QUESTION # 92
You receive a tab-delimited data file name sales.tsv.
You need to connect to the file.
Which option should you select in Tableau Desktop?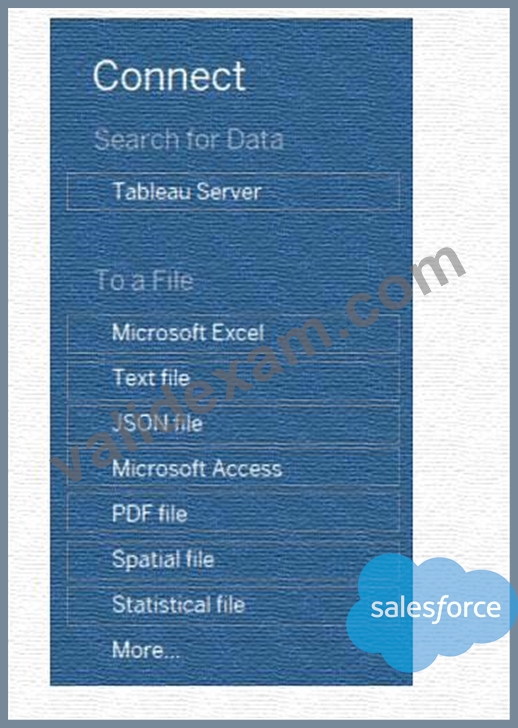
Answer:
Explanation: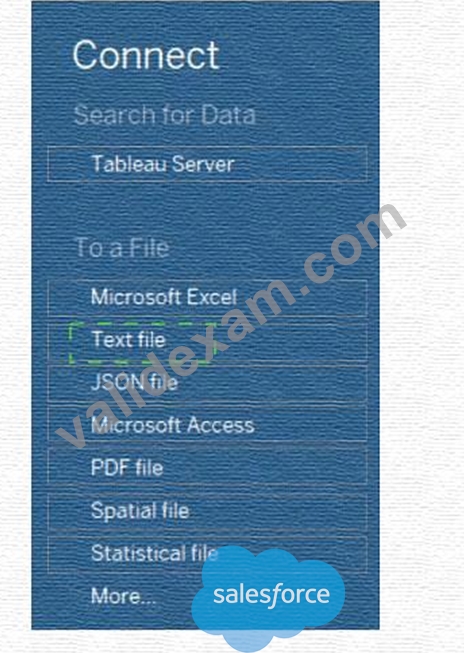
Explanation:
To connect to a tab-delimited data file named sales.tsv, you should select the option To a File > Text file in Tableau Desktop. This option will allow you to browse and select the file from your local or network drive and connect to it as a data source. You can then specify the text file properties, such as the delimiter, the text qualifier, and whether the first row contains column names. You can also join, union, or blend the data with other data sources if needed. References:
* Text File - Tableau
* Tableau Certified Data Analyst Study Guide
NEW QUESTION # 93
A colleague provides a Data Analyst with access to a folder that has the following files:
* Sales.csv
* Book1.json
* Sales.tds
* Export.mdb
Which file can contain information for connecting to an external data source, such as an SQL Server database?
- A. Sales.tds
- B. Book1.json
- C. Sales.csv
- D. Export.mdb
Answer: C
NEW QUESTION # 94
You have a dataset that has four fields named Category. Profit Sates and Customer Name. You need to create the following visualization.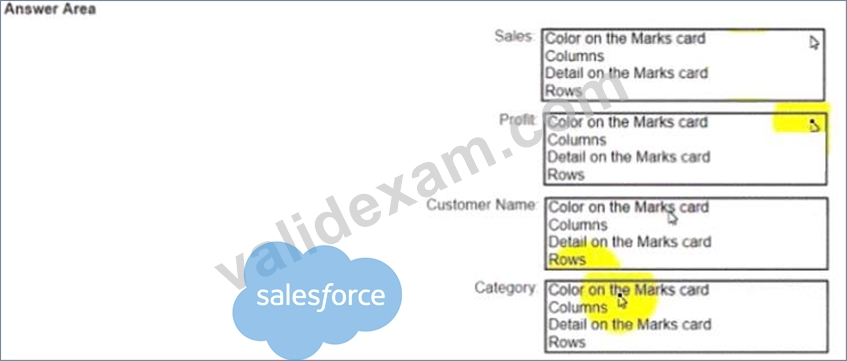
Answer:
Explanation: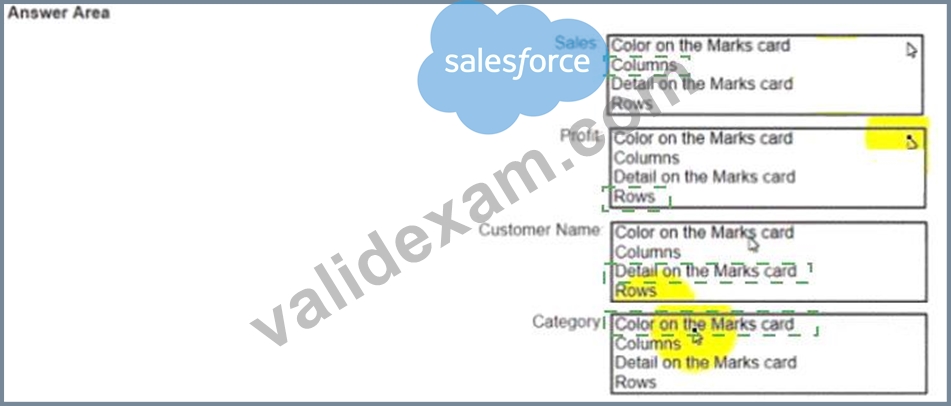
Explanation:
Sales: B. Columns
Profit: D. Rows
Customer Name: C. Detail on the Marks card
Category: A. Color on the Marks card
To create the visualization, you need to drag Sales to Columns, Profit to Rows, Customer Name to Detail on the Marks card, and Category to Color on the Marks card. This will create a scatter plot that shows the relationship between Sales and Profit for each Customer Name, with different colors for each Category.
References: https://help.tableau.com/current/pro/desktop/en-us/buildmanual_shelves.htm
https://help.tableau.com/current/pro/desktop/en-us/buildexamples_scatter.htm
NEW QUESTION # 95
You have a table that contains four columns named Order Date, Country, Sales, and Profit.
You need to add a column that shows the day of the week for each row. For example, orders placed on August
31, 2022, will show a day of
Wednesday.
How should you complete the formula? (Use the dropdowns in the Answer Area to select the correct options to complete the formula.)
Answer:
Explanation: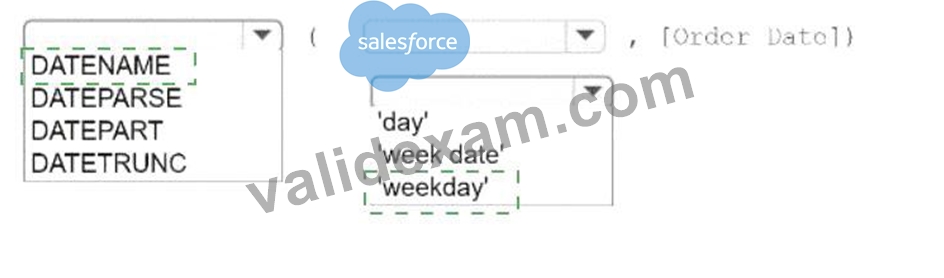
Explanation:
To add a column that shows the day of the week for each row, you should complete the formula as follows:
DATENAME
(
'weekday'
, [Order Date])
The DATENAME function in Tableau returns the name of a specified part of a date or datetime value, such as the year, month, or day. It takes two arguments: the date part and the date. In this question, you want to return the name of the weekday, such as Monday, Tuesday, or Wednesday, for each order date. Therefore, you need to use 'weekday' as the date part and [Order Date] as the date. The formula will return a string value that represents the name of the weekday for each order date.
References:
Tableau Help: DATENAME Function
Tableau Help: Date Functions
To add a column that shows the day of the week for each row, you should complete the formula as follows:
DATENAME
(
'weekday'
, [Order Date])
The DATENAME function in Tableau returns the name of a specified part of a date or datetime value, such as the year, month, or day. It takes two arguments: the date part and the date. In this question, you want to return the name of the weekday, such as Monday, Tuesday, or Wednesday, for each order date. Therefore, you need to use 'weekday' as the date part and [Order Date] as the date. The formula will return a string value that represents the name of the weekday for each order date.
References:
Tableau Help: DATENAME Function
Tableau Help: Date Functions
NEW QUESTION # 96
You have the following dataset that contain null values in the Profits field.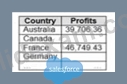
You want the data to appear as shown in the following table.
Which two formulas achieve the goal? Choose two.
- A. ZN ([Profits])
- B. ISNULL ([Profits])
- C. IFNULL [(profits] ,0)
- D. IF [Profits] != null then [Profits] END
Answer: A,C
Explanation:
Both the ZN and IFNULL functions in Tableau can be used to replace NULL values with zeros. The ZN function converts NULL to zero directly, while the IFNULL function allows you to specify that NULL should be replaced with zero. Both will result in showing zero for any NULL values in the Profits field.
References: https://help.tableau.com/current/pro/desktop/en-us/functions_functions_logical.htm#IFNULL
https://help.tableau.com/current/pro/desktop/en-us/functions_functions_logical.htm#IF https://help.tableau.
com/current/pro/desktop/en-us/functions_functions_logical.htm#ZN https://help.tableau.com/current/pro
/desktop/en-us/functions_functions_logical.htm#ISNULL
NEW QUESTION # 97
A Data Analyst needs to update an existing dashboard. The current dashboard shows financial results data, and users have asked for a comparison of budgets to be added to the dashboard. A new data source has been created that includes both the actual costs and budgets and was published to the corporate Tableau site.
How should the analyst update the existing dashboard?
- A. Edit the existing workbook on the Tableau site and connect to the new data source. From the Data menu, choose Replace Data Source.
- B. Create a new workbook in Tableau Desktop and connect to the new data source. Copy and paste all the tabs from the old workbook into the new one.
- C. Edit the existing workbook on the Tableau site and connect to the new data source. Blend the new data source with the existing data source.
- D. Create a copy of the existing workbook, open it in Tableau Desktop, and connect to the new data source. Update each sheet, using fields from the new data source.
Answer: A
NEW QUESTION # 98
You publish a dashboard that uses an extract. The extract refreshes every Monday at 10:00.
You need to ensure that the extract also refreshes on the last day of the month at 18:00.
What should you do?
- A. From Tableau Desktop, open the Publish Workbook dialog box and configure the schedule.
- B. From Tableau Server, select the workbook, select Refresh Extracts, and then add a new extract refresh.
- C. From Tableau Server, select Schedules, and change the priority of the existing schedule.
- D. From Tableau Server, select Schedules, find the schedule of the extract, and change the frequency to the last day of the month.
Answer: B
Explanation:
To ensure that the extract also refreshes on the last day of the month at 18:00, you need to add a new extract refresh task to the workbook on Tableau Server. You can do this by selecting the workbook, selecting Refresh Extracts, and then choosing Schedule a Refresh. You can then select an existing schedule that matches your desired frequency and time, or create a new schedule with a custom frequency and time. This will add a new extract refresh task to the workbook, in addition to the existing one that refreshes every Monday at 10:00. You can also modify or delete the extract refresh tasks as needed. References:
* Tableau Certified Data Analyst Exam Prep Guide, page 10, section "Publishing and Scheduling Data Refreshes"
* Tableau Help: Refresh Data on a Schedule
* Tableau Help: Manage Refresh Tasks
NEW QUESTION # 99
You have the following chart that sorts states by the number of products each state has purchased.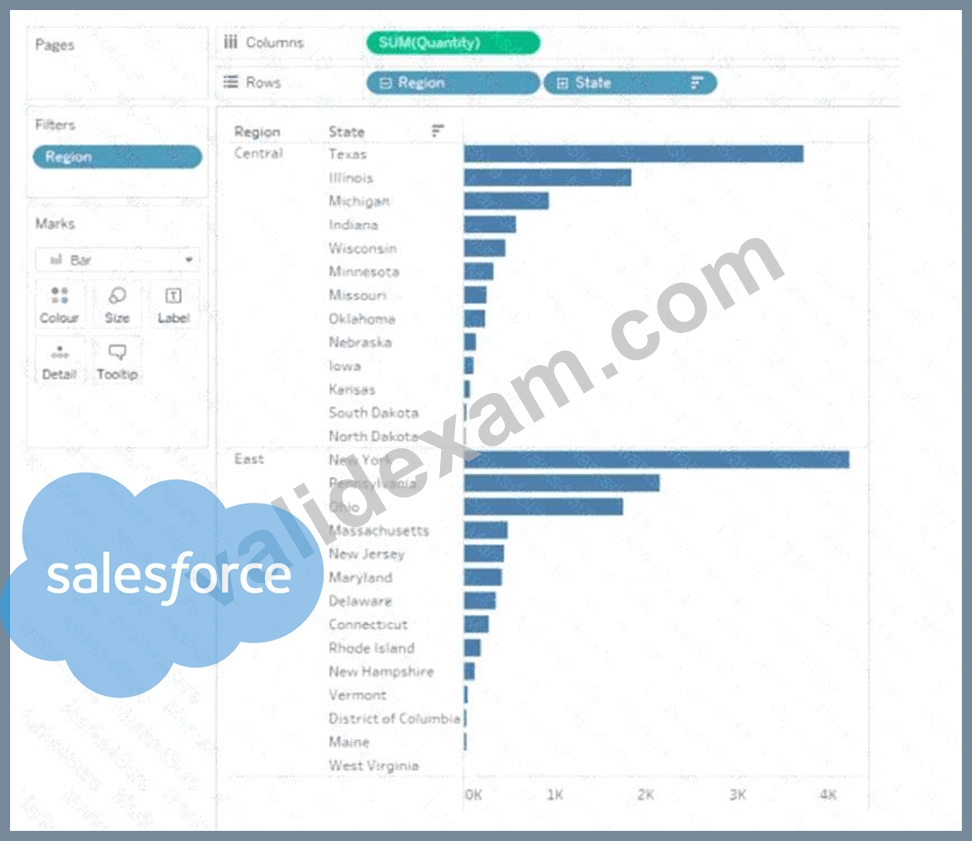
Which formula should you use to include a number with the position of each state within each region?
- A. INDEX ()
- B. WINDOW_SUM(SUM ([Quantity]))
- C. FIRST ()
- D. LOOKUP (SUM ([Quantity]))
Answer: D
Explanation:
The LOOKUP function is used to return the value of a specified field in a different row, which can be defined relative to the current row. In this context, it can be used to include a number with the position of each state within each region by looking up the SUM([Quantity]) in each respective position. References: The information is inferred from general Tableau knowledge as well as the following sources:
* Tableau Functions (Alphabetical)
* LOOKUP
* Tableau Certified Data Analyst Exam Guide
NEW QUESTION # 100
You have two tables named Employeelnfo and DepartmentInfo. Employeelnfo contains four fields named Full Name, Department ID, Start Date, and Salary.
DepartmentInfo contains four fields named Department Name, Size, Department ID, and VP.
You want to combine the tables to meet the following requirements:
. Each record in Employeelnfo must be retained in the combined table.
. The records must contain the Department Name, Size, and VP fields.
* Every record must have a full name.
Which type of join should you use?
- A. Left
- B. Full outer
- C. Inner
- D. Union
Answer: A
Explanation:
To combine the tables and meet the requirements, you should use a left join. A left join will keep all the records from the left table (Employeelnfo) and match them with the records from the right table (DepartmentInfo) based on the common field (Department ID). If there is no matching record in the right table, the fields from the right table will be null. This way, you will retain all the records from Employeelnfo, and also include the Department Name, Size, and VP fields from DepartmentInfo. Every record will have a full name because it is a field from the left table. A left join will look like this:
References:
Join Your Data - Tableau
Join Types in Tableau
NEW QUESTION # 101
You have the following dataset.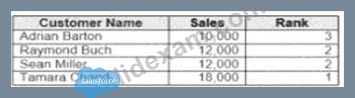
Yon need to calculate the ranking shown in the Rank field.
How should you complete the formula? (Use the dropdowns in the Answer Area to select the correct options to complete the formula ?
Answer:
Explanation:
Explanation:
To calculate the ranking shown in the Rank field, you need to use the RANK_UNIQUE function, which returns the unique rank of each value in a partition. You need to specify the expression as SUM([Sales]), which calculates the total sales for each product. You also need to specify the order as descending, which means that the highest sales will have the lowest rank. Finally, you need to specify the restart as every
[Category], which means that the ranking will reset for each category. References: https://help.tableau.com
/current/pro/desktop/en-us/functions_functions_tablecalculation.htm https://help.tableau.com/current/pro
/desktop/en-us/calculations_calculatedfields_lod_rank.htm
NEW QUESTION # 102
Which syntax should a Data Analyst use to find the first purchase date per customer when Customer is not in the view?
- A. { FIXED [Customer ID] : MIN([Purchase Date]) }
- B. MIN([Purchase Date])
- C. [Customer ID] : MIN([Purchase Date])
- D. [Customer ID] : { [Purchase Date] }
Answer: A
NEW QUESTION # 103
You plan to create a Tableau subscription for several users.
Which two formats can you use? Choose two.
- A. Image
- B. Microsoft PowerPoint
- C. Microsoft Excel
- D. PDF
Answer: A,D
NEW QUESTION # 104
You have the following dataset.
You plan to create a dashboard that will be filtered to show only data that is relevant to a specific Tableau user based on the Tableau_User_Name field You need to create a boolean calculated field to place on the data source finer Which formula should you use for the filter?
- A. ISFULLNAMETableu_USER_NAME))=USERNAME()
- B. NAMEUSERNAME()
- C. NAME Tableau-USER-NAME)
- D. USERNAME()=(Tableau_USER_NAME)
Answer: D
Explanation:
To create a boolean calculated field to place on the data source filter, you should use the formula USERNAME() = [Tableau_user]. This formula will return TRUE if the current Tableau user name matches the value in the Tableau_user field, and FALSE otherwise. You can use this formula as a data source filter by dragging it to the Filters shelf and selecting TRUE from the menu. This will filter the data to show only the rows that are relevant to the specific Tableau user.
The other options are not correct for this scenario. NAME([Tableau_user]) is not a valid function in Tableau.
ISFULLNAME([Tableau_user]) = USERNAME() is not a valid expression in Tableau. 'S' + STR([Sales]
/1000) is not a boolean expression, but a string expression that converts sales to thousands with a prefix of
"S". References: https://help.tableau.com/current/pro/desktop/en-us/filtering_datasource.htm https://help.
tableau.com/current/pro/desktop/en-us/functions_functions_logical.htm#USERNAME https://help.tableau.
com/current/pro/desktop/en-us/calculations_calculatedfields.htm
In Tableau, the USERNAME() function returns the username of the user who is currently logged in. To create a filter that only shows data relevant to the logged-in Tableau user, a boolean calculated field can be created to compare the current username with the usernames listed in the Tableau_User_Name field of the dataset. Therefore, the correct formula for this filter is USERNAME() = [Tableau_USER_NAME], which will return true for rows where the Tableau_User_Name matches the current user's username.
NEW QUESTION # 105
A Data Analyst has the following chart that shows the sum of sales made in different cities.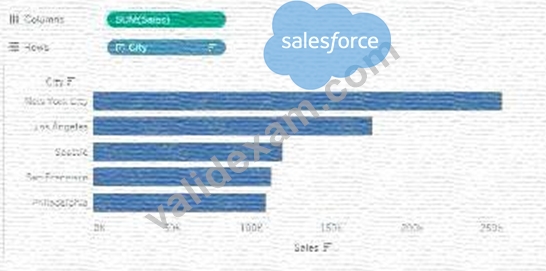
The analyst wants to show the average sale amount for a city when users hover their mouse over any of the bars.
What should the analyst do?
- A. Right-click on SUM(Sales) in the Columns and select Include in Tooltip.
- B. Drag Sales to Tooltip on the Marks card and change Aggregation to Average.
- C. Drag Sales to Tooltip on the Marks card and modify the Tooltip text.
- D. Right-click on SUM(Sales) in the Columns and change Aggregation to Average.
Answer: B
NEW QUESTION # 106
A Data Analyst has the following view.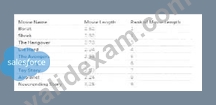
The analyst wants to filter the view to show only records that have a movie name starting with the word
"The". The analyst must achieve the goal without writing any formulas.
Which type of filter should the analyst use?
- A. Top
- B. General
- C. Condition
- D. Wildcard
Answer: D
NEW QUESTION # 107
You want to connect a Tableau workbook to a dataset in a Microsoft Excel spreadsheet.
What should you do from Tableau Desktop?
- A. From the Data menu select Replace Data Source
- B. From the File menu select New
- C. From the Data menu select New Data Source
- D. From the File menu select Import Workbook
Answer: C
Explanation:
To connect a Tableau workbook to a dataset in a Microsoft Excel spreadsheet, you need to select New Data Source from the Data menu. This will open the Connect pane, where you can choose Microsoft Excel as your data source and browse for your spreadsheet file. You can then drag and drop your sheets or tables to join or union them in the data source page. References: https://help.tableau.com/current/pro/desktop/en-us
/connect_basic.htm https://help.tableau.com/current/pro/desktop/en-us/connect_excel.htm When connecting to a dataset in Tableau Desktop, you would go to the 'Data' menu and select 'New Data Source'. This allows you to connect to various types of data sources, including Microsoft Excel spreadsheets, where you can then select the specific file you wish to connect to.
NEW QUESTION # 108
......
Verified Analytics-DA-201 dumps Q&As Latest Analytics-DA-201 Download: https://www.validexam.com/Analytics-DA-201-latest-dumps.html
Free Salesforce Analytics-DA-201 Exam Questions and Answer: https://drive.google.com/open?id=1GGFyxOh1qtIlrs8SvXOH5XAfGRj-Ilzv