


[Oct 31, 2025] Snowflake DAA-C01 Exam Dumps Are Essential To Get Good Marks
Latest Snowflake DAA-C01 Dumps with Test Engine and PDF (New Questions)
NEW QUESTION # 107
You are tasked with creating a dashboard that displays the average transaction amount for each customer segment. However, sensitive customer information, such as credit card numbers, is stored in the 'TRANSACTIONS table and protected by Dynamic Data Masking. The masking policy replaces the credit card number with 'XXXX-XXXX-XXXX-XXXX'. The dashboard needs to allow analysts to drill down into individual transactions to identify fraud patterns, but without exposing the actual credit card numbers. Which of the following approaches is the MOST secure and efficient way to achieve this?
- A. Create a view that selects all columns from the 'TRANSACTIONS table. Grant the 'ANALYST ROLE 'SELECT privilege on the view. The masking policy will automatically apply, preventing analysts from seeing the actual credit card numbers. Allow drill-down on all available fields.
- B. Create a role hierarchy where the 'ANALYST ROLE inherits from a ROLE' that has the 'APPLY MASKING POLICY privilege on the column. Grant the 'ANALYST_ROLE 'SELECT privilege on the 'TRANSACTIONS' table. This allows drill-down while preserving the masked credit card numbers.
- C. Create a stored procedure that executes with 'CALLER rights. The stored procedure queries the 'TRANSACTIONS' table and returns the data. Grant the 'ANALYST ROLE execute privilege on the stored procedure. This approach bypasses the masking policy but provides more control over which data is displayed during drill-down.
- D. Create a UDF (User-Defined Function) that partially unmasks the credit card number, revealing only the last four digits. Apply this UDF in the dashboard when drilling down. This allows analysts to identify patterns while protecting most of the sensitive data.
- E. Create a tokenization service outside of Snowflake. Replace the credit card numbers in the 'TRANSACTIONS table with tokens. Store the mapping between tokens and credit card numbers securely. Provide the analysts with access to the tokenization service to de-tokenize the credit card numbers only when absolutely necessary for fraud investigation. The dashboard displays the tokenized values, and drill-down leads to a request to the tokenization service.
Answer: A
Explanation:
Option A is the most secure and efficient approach. Dynamic Data Masking is designed to automatically apply masking policies to columns when they are queried, regardless of whether the query is executed directly or through a view. This ensures that analysts will always see the masked credit card numbers, preventing unauthorized access to sensitive data. Options C and E introduce external services, while Option D weakens masking and option B does not apply the masking by itself. Role hierarchy is an authorization concept, not a masking concept.
NEW QUESTION # 108
When maintaining reports and dashboards, why is it crucial to build automated and repeatable tasks?
- A. Repeatable tasks hinder data updates in dashboards.
- B. Automated tasks reduce manual efforts, ensuring consistency.
- C. Automated tasks increase the complexity of dashboard management.
- D. They ensure inconsistency in reports and dashboards.
Answer: B
Explanation:
Automated tasks reduce manual efforts, ensuring consistency in reports and dashboards.
NEW QUESTION # 109
You observe that a Snowflake query, intended to perform aggregations on a 'SALES table (partitioned by 'SALE DATE), exhibits unexpectedly poor performance despite the data being relatively well clustered. Further investigation reveals that a user recently modified the 'SESSION' parameter NTE OUTPUT FORMAT to 'YYYY-MM'. The aggregation query filters the 'SALES' table using a 'WHERE clause on 'SALE DATE. Which of the following explains the performance degradation, and what actions can be taken to remediate?
- A. The modified causes Snowflake to perform implicit conversions on 'SALE_DATE in the 'WHERE clause, preventing partition pruning. Modify the query to use a consistent date format or reset the session parameter.
- B. The change in impacts the cost-based optimizer and impacts the explain plan, causing a full table scan, use 'ALTER SESSION SET DATE OUTPUT FORMAT = 'AUTO".
- C. The change in alters the internal storage format of 'SALE_DATE, invalidating existing clustering metadata. Re-clustering the 'SALES' table is required.
- D. The parameter is irrelevant to query performance as it only affects the output representation of dates. The performance issue is due to a different factor, such as insufficient warehouse size.
- E. The change in increases the size of the query's result set, leading to network bottlenecks. Reduce the number of columns returned by the query.
Answer: A,B
Explanation:
The parameter itself doesn't change underlying data or invalidate clustering directly (A). While a larger result set can impact network (C), it's less likely than partition pruning issues in this scenario. 'DATE OUTPUT FORMAT can affect query performance if it causes implicit conversion on 'DATE columns in 'WHERE clauses, which can prevent partition pruning; setting it back to 'AUTO' or default behavior fixes this. The optimizer can be affected, forcing full table scan which is sub-optimal.
NEW QUESTION # 110
A data analyst is investigating a decline in the conversion rate on an e-commerce website. They have access to the following tables in Snowflake: 'sessions': 'session id', 'user id', 'start time', 'end_time' 'page views': 'session id', 'page_urr, 'view time' 'transactions': 'session_id', 'transaction id', 'amount', 'transaction_time' Which of the following approaches, using Snowflake features, would be MOST effective for identifying potential bottlenecks or drop-off points in the user journey?
- A. Use Snowflake's 'SHOW TABLES' command to identify the most frequently updated tables. Then, create a dashboard on these tables to monitor the rate of changes.
- B. Implement a data lineage tool to trace the flow of data from raw sources to the transaction table. This will reveal any data quality issues that may be impacting conversion rates.
- C. Create a funnel analysis by defining key stages in the user journey (e.g., homepage visit, product page view, add to cart, checkout, purchase). Use window functions to track users as they progress through the funnel, calculating conversion rates between each stage. Visualize the funnel using a BI tool for easy identification of drop-off points.
- D. Perform a cohort analysis by grouping users based on their sign-up date or initial website visit date. Track their conversion rates over time. Use a data visualization tool to see if any group exhibits an unusual drop in the conversion rate.
- E. Use recursive SQL common table expressions (CTEs) to reconstruct the entire user journey for each session, from the entry page to either a successful transaction or session termination. Analyze path completion rates at each step to identify the pages where users are most likely to abandon the session.
Answer: C,D
Explanation:
Options B and C provide useful diagnostic insights. B offers direct information about conversion at each stage of the funnel. Option C enables discovery of unusual drops over time. Option A might be a difficult, resource intensive solution for complex user journeys. Option D is a poor approach as it identifies the rate of change in tables instead of the main objective - bottlenecks or drop-off points. Option E, while helpful for data governance, doesn't directly pinpoint user journey issues.
NEW QUESTION # 111
You have a large CSV file containing customer transaction data that you need to load into Snowflake using Snowsight. The CSV file is located in an AWS S3 bucket. The file contains fields like 'transaction id', 'customer id', 'transaction date', and 'transaction amount. However, the 'transaction_date' column is in the format 'YYYYMMDD' and you need to convert it to Snowflake's DATE format ('YYYY-MM-DD') during the load process. Which of the following steps should you take in Snowsight to accomplish this efficiently and correctly?
- A. Use Snowsight's 'Load Data' wizard to load the CSV file directly into a table with the required schema. After loading, execute an "UPDATE statement to convert the 'transaction_date' column using 'TO DATE(transaction_date, YYYYMMDD'V.
- B. Load the CSV file into Snowflake without any transformation. Write a stored procedure to transform the 'transaction_date' column and schedule the stored procedure to run periodically.
- C. Create an external table pointing to the S3 bucket. Then, create a view on top of the external table with the 'TO_DATE(transaction_date, 'YYYYMMDD')' transformation applied. Finally, create a new table using 'CREATE TABLE AS SELECT from the view.
- D. Create a new table in Snowflake with the desired schema (including DATE data type for 'transaction_date'). Use Snowsight's 'Load Data' wizard to load the CSV file, selecting the appropriate file format options and using a computed column expression 'TO_DATE(transaction_date, 'YYYYMMDD')' for the 'transaction date' column.
- E. Load the data into a staging table with all columns as VARCHAR. Then, create a new table with the desired schema. Finally, use a 'CREATE TABLE AS SELECT (CTAS) statement with 'TO DATE(transaction_date, to transform and load the data from the staging table to the final table.
Answer: D
Explanation:
Option A is the most efficient and correct approach. Snowsight's 'Load Data' wizard allows you to specify transformations during the load process using computed columns, which is more performant than loading into a staging table or updating after loading. Options B, C, D and E are functional but less efficient due to the extra steps involved. Using external tables for initial loading then CTAS can be good for exploration but not as direct as option A. Updates should generally be avoided on large datasets after loading when you have a chance to transform during load.
NEW QUESTION # 112
You are investigating why a Snowflake data replication process between two regions is experiencing significant lag. You need to collect data to determine if the issue stems from network latency, insufficient warehouse resources in the target region, or data transformation bottlenecks. Select the data collection methods that will provide the MOST relevant insights.
- A. Monitor the CPU utilization of the virtual machines running the Snowflake service in both regions.
- B. Monitor the replication lag metrics (e.g., DATABASE REPLICATION_LAG, TABLE REPLICATION_LAG) exposed through Snowflake system functions and the web interface for both the source and target regions.
- C. Run traceroute commands between the source and target regions to measure network latency.
- D. Analyze the query history in the target region to identify slow-running transformation queries that might be bottlenecking the replication process.
- E. Restart the data replication process.
Answer: B,C,D
Explanation:
Options A, B, and C provide specific data points relevant to the identified potential causes. Monitoring replication lag metrics (A) directly quantifies the lag. Traceroute (B) measures network latency. Analyzing query history (C) identifies transformation bottlenecks. Restarting the process (D) might temporarily resolve the issue but doesn't address the root cause. Snowflake manages the underlying infrastructure; therefore, monitoring VM CPU utilization (E) is not something that a data analyst has access to or is needed for the diagnostic in this case. The Snowflake service runs and manages the queries.
NEW QUESTION # 113
A data analyst is working with a large table partitioned by (DATE type). The table contains millions of rows spanning several years. They need to optimize a query that retrieves sales data for a specific quarter of 2023. The initial query is: 'SELECT FROM sales_data WHERE EXTRACT(YEAR FROM sale_date) = 2023 AND EXTRACT(QUARTER FROM sale_date) = To improve performance using partition pruning, which of the following queries is the MOST efficient alternative?
- A.

- B.

- C.

- D.

- E.

Answer: D
Explanation:
Option A is the most efficient because it directly uses the 'sale_date' column with a 'BETWEEN' clause using specific date values. This allows Snowflake to directly leverage the partition pruning based on the date range. Options B and C use functions C YEAR, 'QUARTER on the 'sale_date' column, preventing efficient partition pruning. Option D uses 'LIKE', which is not suitable for date comparisons and would likely result in a full table scan, furthermore 'LIKE operator will not work with Date Data type. Option E does not prune to a specific quarter.
NEW QUESTION # 114
You are building a dashboard to monitor the performance of a Snowflake data pipeline. This pipeline ingests data from various sources, transforms it, and loads it into target tables. You want to visualize the overall pipeline latency, including the time spent in each stage (ingestion, transformation, loading). You have access to event logs that capture the start and end timestamps for each stage of each pipeline run. The logs are stored in a Snowflake table named 'PIPELINE LOGS' with columns: 'PIPELINE RUN (VARCHAR), 'STAGE_NAME' (VARCHAR), 'START_TIMESTAMP' (TIMESTAMP_NU), 'END_TIMESTAMP (TIMESTAMP_NTZ). Which visualization type and query construct provides the MOST effective way to visualize the latency of each stage within each pipeline run, allowing for easy identification of bottlenecks?
- A. A Gantt chart displaying the start and end times of each stage for each pipeline run, created using a query that calculates the duration of each stage using 'TIMESTAMPDIFF()'.
- B. A line chart showing the total latency of each pipeline run over time, calculated using the 'SUM()' aggregate function and grouping by and date.
- C. A bar chart showing the average latency for each stage, calculated using the aggregate function and grouping by 'STAGE_NAME'.
- D. A box plot visualizing the distribution of latencies for each stage, generated using a query with window functions to calculate percentiles and outliers.
- E. A heatmap showing correlation between start_timestamp and end_timestamp for each pipeline run for all stages.
Answer: A
Explanation:
A Gantt chart (C) is the most effective visualization for this scenario. It directly shows the start and end times of each stage within each pipeline run, making it easy to visually identify bottlenecks and understand the overall timeline. The query would need to calculate the duration of each stage using 'TIMESTAMPDIFF()' to determine the length of each bar in the Gantt chart. The other options provide aggregated summaries (A, D) or distributions (B) that don't directly show the temporal relationship between stages within each pipeline run. Heatmap is not so useful here.
NEW QUESTION # 115
A data analyst is tasked with loading data into a Snowflake table 'ORDERS' with the following structure: 'CREATE TABLE ORDERS ( ORDER ID INT, CUSTOMER ID INT, ORDER DATE DATE, TOTAL_AMOUNT The data analyst needs to ensure that 'ORDER ID' is unique and not null, 'CUSTOMER ID' references a valid customer in the 'CUSTOMERS' table (column name 'CUSTOMER ID'), and 'ORDER DATE' is not in the future. Which of the following combination of constraints is the most efficient and appropriate way to enforce these Fules in Snowflake? 'CREATE TABLE CUSTOMERS ( CUSTOMER ID INT PRIMARY KEY, CUSTOMER_NAME VARCHAR(255));'.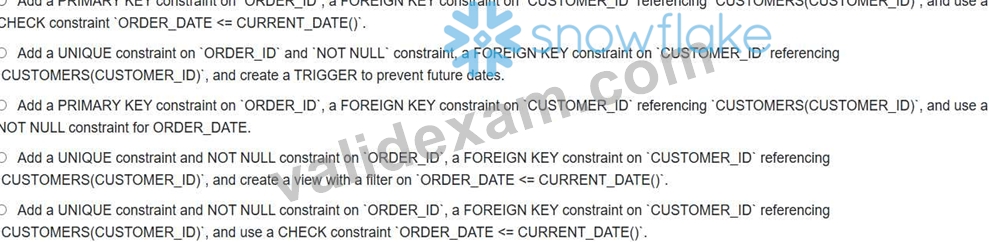
- A. Option D
- B. Option B
- C. Option A
- D. Option C
- E. Option E
Answer: E
Explanation:
Option E is the most appropriate and efficient. Using a PRIMARY KEY implies an index which while beneficial for joins isn't necessary if simple uniqueness and not null are the primary requirement. A CHECK constraint 'ORDER_DATE <= is the best way to prevent future dates as TRIGGER is not available and view doesn't prevent data from being ingested.
NEW QUESTION # 116
When dealing with semi-structured data in Snowflake, what advantages do native data types offer over traditional relational data types?
- A. Native data types offer higher data integrity and consistency
- B. Native data types provide flexibility in handling varied data structures
- C. Native data types limit query complexity and optimization
- D. Native data types enforce strict schema requirements
Answer: B
Explanation:
Native data types in Snowflake offer flexibility in handling varied structures of semi-structured data, allowing for a more adaptable approach compared to traditional relational data types.
NEW QUESTION # 117
A Snowflake table 'USER ACTIVITY' contains a column 'ACTIVITY TIMESTAMP' of type VARCHAR, which stores timestamps in different formats, including ISO 8601 (e.g., '2023-10-27 Unix epoch seconds (e.g., '1698400800'), and milliseconds (e.g., '1698400800000'). You need to convert all these timestamps into a consistent TIMESTAMP NTZ data type in Snowflake. Which approach offers the most efficient and accurate solution for converting these diverse timestamp formats into a unified TIMESTAMP NTZ?
- A. Create separate temporary tables for each timestamp format using 'TO_TIMESTAMP' , then UNION ALL them together.
- B. Utilize Snowflake's automatic type conversion capabilities by simply changing the column's data type to TIMESTAMP_NTZ using ALTER TABL
- C. Use a series of 'CASE' statements with ' TO_TIMESTAMP' and multiple format strings to parse each format individually.
- D. Use a UDF (User-Defined Function) that intelligently detects the timestamp format and applies the appropriate conversion function CTO TIMESTAMP , etc.).
- E. First convert epoch milliseconds to epoch seconds by dividing by 1000. Then use a single 'TO TIMESTAMP' function assuming default ISO 8601 format.
Answer: D
Explanation:
Option C provides the most efficient and accurate solution. While 'CASE' statements (Option A) are viable, they can become complex and less maintainable with many formats. Creating temporary tables (Option B) is inefficient. Dividing milliseconds and assuming ISO 8601 (Option D) will fail for true ISO 8601 formats and might cause loss of precision. Snowflake's automatic type conversion (Option E) won't handle the mixed formats. A UDF (Option C) encapsulates the logic for format detection and conversion, promoting code reusability and maintainability. It allows you to use different Snowflake functions within the UDF to parse different formats, ensuring accurate conversion to a unified TIMESTAMP NTZ data type.
NEW QUESTION # 118
You have a large dataset in Snowflake containing customer order information stored in a table named 'ORDERS' with columns 'ORDER_ID' ONT), 'CUSTOMER_ID' ONT), 'ORDER_DATE (DATE), 'TOTAL_AMOUNT' (FLOAT), and 'DISCOUNT_APPLIED' (BOOLEAN). You need to use Snowsight dashboards to analyze customer spending behavior and identify potential outliers. Which of the following visualizations, combined with appropriate SQL queries, would be MOST effective in identifying customers with unusually high or low order values? (Select TWO)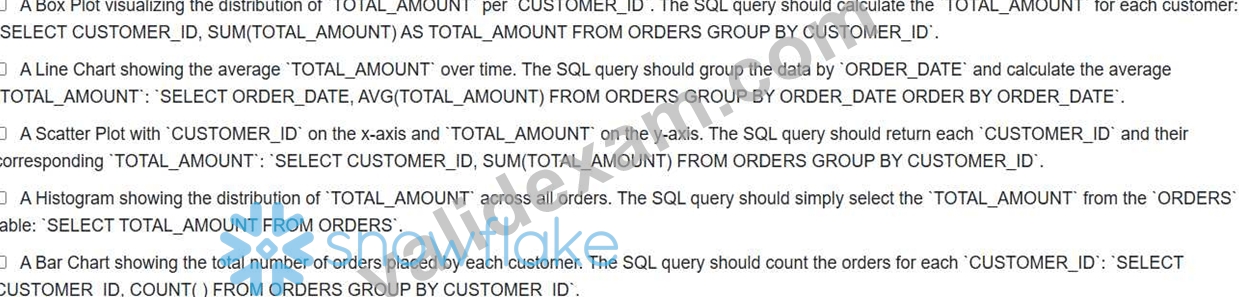
- A. Option D
- B. Option E
- C. Option B
- D. Option C
- E. Option A
Answer: D,E
Explanation:
Options A and C are the most effective. A Box Plot (A) is ideal for identifying outliers in a distribution. By visualizing the distribution of total order amounts per customer, you can easily spot customers with unusually high or low spending. A Scatter Plot (C) directly shows the relationship between customer ID and total spending, making it easy to visually identify outliers based on their position relative to other data points. Option B is more suitable for trend analysis over time, and options D and E are useful but don't directly highlight individual customer outliers in terms of order value.
NEW QUESTION # 119
You have a Snowflake table 'CUSTOMER ORDERS with columns 'CUSTOMER ID', 'ORDER DATE, and 'ORDER AMOUNT. You need to calculate the cumulative sum of 'ORDER AMOUNT' for each customer, ordered by 'ORDER DATE. However, due to potential late-arriving data, you also need to implement a windowing function that resets the cumulative sum if there's a gap of more than 30 days between consecutive orders for a customer. Which SQL query best accomplishes this?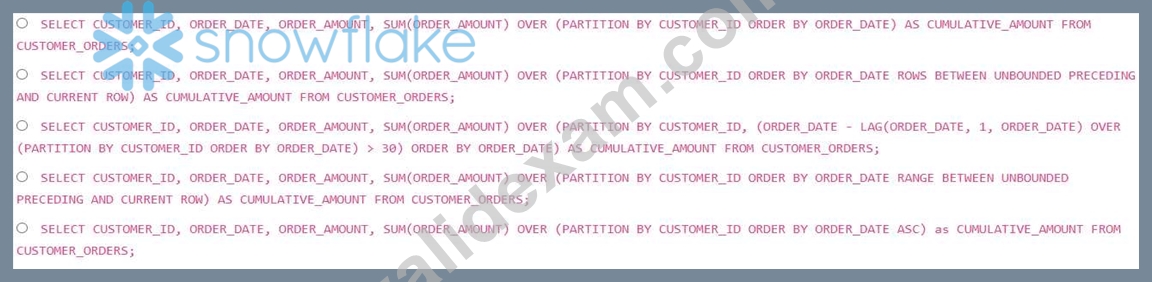
- A. Option D
- B. Option E
- C. Option B
- D. Option A
- E. Option C
Answer: E
Explanation:
Option C correctly uses a conditional partitioning approach. UG(ORDER DATE, 1, ORDER DATE) OVER (PARTITION BY CUSTOMER_ID ORDER BY ORDER_DATE)' calculates the previous order date for each customer. (ORDER_DATE - 1, ORDER DATE) OVER (PARTITION BY CUSTOMER ID ORDER BY ORDER DATE) > 30)' creates a boolean expression that is true when the difference between consecutive order dates exceeds 30 days. This boolean expression is then used as a secondary partition key, effectively restarting the cumulative sum whenever a gap of more than 30 days occurs. The primary partition is still 'CUSTOMER ID' , ensuring sums are calculated within each customer's order history. The ordering of 'ORDER_DATE is essential for the cumulative sum to be calculated chronologically.
NEW QUESTION # 120
You are preparing a CSV file for ingestion into Snowflake, and you need to ensure that the data types are correctly interpreted. The CSV contains a column named 'transaction_amount' that sometimes contains values with leading zeros (e.g., '00123.45'). You want to load this data into a Snowflake table where 'transaction_amount' is defined as NUMBER(IO, 2). Without modifying the CSV file itself, how can you ensure that the leading zeros are handled correctly during the COPY INTO operation?
- A. During the COPY INTO operation, use the 'TRANSFORM_COLUMN' option to cast the VARCHAR column to a NUMBER(10, 2). Snowflake will implicitly handle the leading zeros during the cast.
- B. Use the 'STRIP file format option to remove the leading zeros before loading.
- C. Use the 'VALIDATE option in COPY INTO to identify rows with leading zeros and manually correct them in the CSV file.
- D. Snowflake automatically handles leading zeros in numeric fields during COPY INTO, so no special action is required.
- E. Define the 'transaction_amount' column as VARCHAR in Snowflake, load the data, and then cast it to NUMBER(10, 2) using a transformation query, which will implicitly remove leading zeros.
Answer: A
Explanation:
Option E is the correct approach. Snowflake implicitly handles leading zeros when casting a VARCHAR column to a NUMBER type using during the COPY INTO operation. This avoids modifying the original CSV file or requiring a separate transformation step after loading. Option A is incorrect, as implicit type conversion might not always work as expected. Option B and C are incorrect because 'STRIP NULL_VALUE' is not relevant in the case of leading zeros. Option D is viable, but less efficient than handling during load time.
NEW QUESTION # 121
You have a Snowflake table called 'CUSTOMER ORDERS that stores customer order data'. The business requires you to generate a weekly report on the top 10 customers by order value, delivered as an Excel file to a shared network drive. The network drive is accessible by a service account that your Snowflake account can authenticate against. The report must include customer name, total order value, and number of orders. Which approach is the MOST secure and efficient for automating this process?
- A. Create a Snowflake external function using AWS API Gateway and AWS Lambda. The external function queries the data from Snowflake, formats it as an Excel file using a Python library (e.g., openpyxl) within the Lambda function, and saves the file directly to the network drive using the service account's credentials. Configure API Gateway to authenticate requests from Snowflake.
- B. Create a Snowflake Task that executes a stored procedure. The stored procedure uses a Snowflake Scripting block to query the data, format the data using Javascript UDF to XML, write the Excel file to an internal stage using Java UDF, and then use a Python UDF to copy the file to the network drive. Grant necessary permissions to the task's service account.
- C. Use a Snowflake Task to trigger a Snowpipe. A Snowflake stored procedure that executes SQL code to query for relevant data, convert it to JSON, then the Snowpipe load into the network directory using REST API. Grant necessary permissions to the task's service account.
- D. Leverage a Snowflake Task to run a stored procedure. The procedure queries the data, transforms it into CSV format using Snowflake scripting. Then uses a Java UDF to copy the CSV to an internal stage, from where a separate process (outside Snowflake) monitors for new files and transfers them to the network drive using the service account. Securely manage credentials for both the Java UDF and the external process.
- E. Create a view on top of the CUSTOMER_ORDERS table that calculates the required metrics. Use a third-party ETL tool to extract the data from the view, format it as an Excel file, and save it to the network drive. Configure the ETL tool with appropriate Snowflake credentials.
Answer: D
Explanation:
Option E provides a balance of security and efficiency. By creating a task that runs a stored procedure, converting data to CSV and using Java UDF to copy to an internal stage. A external process which is also monitoring the file and move to network directory using service account. It encapsulates logic within Snowflake and minimizes external dependencies. This approach avoids directly exposing Snowflake credentials to a third-party ETL tool or directly accessing the network drive from within Snowflake, which are security concerns. Option A involves writing directly to the network drive from within Snowflake, which may be complex to set up securely. Option B is generally not recommended due to external function overhead. Option C Introduces external dependency and Snowflake credentials needs to be managed carefully for the third party ETL tool. Option D is not possible since Snowpipe doesn't have capability to load into the network directory directly.
NEW QUESTION # 122
When handling CSV, JSON, and Parquet data types for consumption, what advantages do Parquet files typically offer over the others?
- A. Parquet files provide better compression and query performance
- B. CSV files are more efficient in handling nested data structures
- C. Parquet files are not suitable for large datasets
- D. JSON files offer more flexibility in schema changes
Answer: A
Explanation:
Parquet files often provide better compression and query performance compared to CSV and JSON due to their columnar storage format, enhancing efficiency in handling large datasets.
NEW QUESTION # 123
How do diverse chart types (e.g., bar charts, scatter plots, heat grids) contribute to effective data presentation and visualization in reports and dashboards?
- A. They limit data representation options for simplicity.
- B. Different chart types offer varied data representation for better analysis.
- C. Diverse chart types restrict data exploration in reports and dashboards.
- D. Charts don't impact data visualization in reports or dashboards.
Answer: B
Explanation:
Different chart types offer varied data representation, aiding better analysis in reports and dashboards.
NEW QUESTION # 124
Consider a Snowflake table 'USER EVENTS' with a 'VARIANT' column named 'event_data' containing JSON objects representing user activity. The JSON structure varies significantly across rows. You need to extract all the distinct event types from this data'. Which of the following Snowflake queries is the most efficient way to achieve this, handling potential null or missing 'event_type' fields gracefully and avoiding errors? Assume the volume of data is very large.
- A.

- B.

- C.

- D.

- E.

Answer: A
Explanation:
Option C, using , is the most efficient and robust solution. attempts to convert the JSON value to a string and returns NULL if the conversion fails (e.g., if is an object or array, not a string or a value that can be cast to a string). This avoids errors and simplifies the query. Using 'DISTINCT on the result then gives the distinct event types. Options A, B, D and E have the overhead of IS NULL or NVL functions, that make processing slower and inefficeint compared to C. While these options handle nulls, they are more verbose and potentially less performant due to the explicit null checks. Option A will also exclude rows where event_data:event_type is actually NULL, which might be undesirable.
NEW QUESTION # 125
......
ValidExam just published the Snowflake DAA-C01 exam dumps!: https://www.validexam.com/DAA-C01-latest-dumps.html
Pass Your DAA-C01 Exam Easily - Real DAA-C01 Practice Dump Updated: https://drive.google.com/open?id=1c-H0kT6AXPvOFH4Ll8vIZWR7PowGo2fE