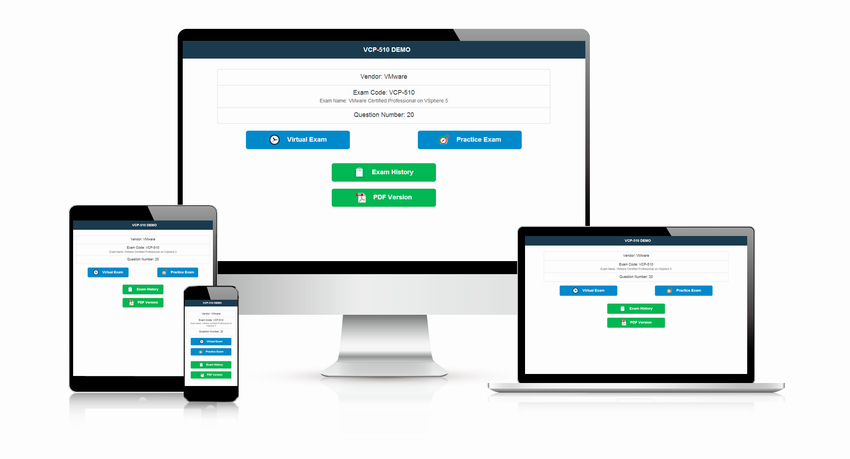
Free Demo


Our concept is simple: best quality practice products with best customer service. ValidExam's Qlik Sense Business Analyst Certification Exam - June 2018 Release set delivers 50 practice questions for the QSBA2018 exam plus 24/7 assistance.
Qlik QSBA2018 Exam Overview:
| Certification Vendor: | Qlik |
|---|---|
| Exam Name: | Qlik Sense Business Analyst Certification Exam - June 2018 Release |
| Exam Number: | QSBA2018 |
| Exam Format: | Multiple-answer, Multiple-choice |
| Certificate Validity Period: | 2 years |
| Available Languages: | English |
| Passing Score: | 70% |
| Real Exam Qty: | 50 |
| Exam Duration: | 120 minutes |
| Exam Price: | $250 USD |
| Related Certifications: | Qlik Sense Data Architect Qlik Sense System Administrator |
| Recommended Training: | Qlik Official Training Qlik Help Documentation |
| Exam Registration: | Pearson VUE Registration |
| Sample Questions: |  |
| Exam Way: | Online proctored or onsite at Pearson VUE test centers |
| Pre Condition: | No mandatory prerequisites; recommended practical experience with Qlik Sense |
| Official Syllabus URL: | https://www.qlik.com/us/services/training/certification |
Qlik QSBA2018 Exam Syllabus Topics:
| Section | Weight | Objectives |
|---|---|---|
| Topic 1: Prepare and Load Data | 30% | - Transform and clean data - Create efficient data models - Resolve synthetic keys and associations - Connect to various data sources |
| Topic 2: Develop Applications | 25% | - Implement master items and reusable assets - Optimize app performance - Use advanced functions and expressions - Build visualizations and dashboards |
| Topic 3: Identify Requirements | 20% | - Determine user types and access requirements - Gather and interpret business needs - Define KPIs, metrics, and dimensions |
| Topic 4: Design Applications | 25% | - Plan app structure and navigation - Select appropriate visualizations - Apply design best practices and usability principles |
Qlik Sense Business Analyst Certification Exam - June 2018 Release Exam FAQ — Effective Answers
Delivery is instant: payment triggers an automatic email within a minute — unlimited installations, and 24/7 customer assisting for any downloading or purchasing issue if nothing arrives within 2 hours. If you fail the corresponding QSBA2018 exam within 60 days of purchase, choose your remedy: a full refund (scanned enrollment slip plus the official Score Report PDF within 2 days of the exam; processed within 7 days), waiting for the next updated version free, or a free change to two other equal-value dumps. Excluded: exams within 3 days of purchase, candidate names that don't match the payer, and free or expired products.
120 minutes for 50 questions. Fit the atmosphere in advance: timed sessions in the ValidExam online engine make the formal pace feel practiced, not pressured.
Use the vendor's official registration channels:
The Qlik Sense Business Analyst Certification Exam - June 2018 Release is delivered Online proctored or onsite at Pearson VUE test centers — select whichever arrangement suits you when booking.
The Qlik Sense Business Analyst Certification Exam - June 2018 Release blueprint spans 4 domains — including Develop Applications (25%), Design Applications (25%), Prepare and Load Data (30%). Let the weightings direct your spare-time review; the full outline above lists every subtopic.
Yes — download the free Qlik Sense Business Analyst Certification Exam - June 2018 Release demo and evaluate the material before paying. Purchases include 365 days of free updates, each new version emailed immediately upon release; renew afterward at 50% off.
No mandatory prerequisites; recommended practical experience with Qlik Sense Eligibility rules change periodically, so confirm the current requirements on the official page (official QSBA2018 exam page) before registering.
Yes:
Courses give you the theory; the 50 practice questions for the Qlik Sense Business Analyst Certification Exam - June 2018 Release give you the rehearsal — every answer expert-verified.
The Qlik Sense Business Analyst Certification Exam - June 2018 Release is Qlik's certification exam for Qlik Sense Business Analyst Certification, at the Professional level. It validates job-ready skills, and passing it marks you as a verified professional. Related credentials include Qlik Sense Data Architect, Qlik Sense System Administrator.
$250 USD per attempt, 70% to pass. A retake costs the full fee again — effective preparation with the 50 practice questions for the QSBA2018 exam is the economical path.
Qlik Sense Business Analyst Certification Exam - June 2018 Release Sample Questions:
Refer to the exhibit.
A company is starting to use a new customer account system. The business analyst must include this data in an existing app Data from the legacy customer account system is already available in the app Both tables have similar data, but the columns have different names Which actions should the business analyst take to merge data from both systems?
- A. 1. Select New Customer Accounts
2 Drag it over Legacy Accounts
3 Rename the association 4. Click Apply - B. 1. Select New Customer Accounts
2 Drag it over Invoices
3 Define the association
4 Click Apply - C. 1 Select Legacy Accounts
2 Click Concatenate tables
3 Select New Customer Accounts
4 Map the tables 5. Click Apply - D. 1 Select Legacy Accounts
2 Click Concatenate tables
3 Select New Customer Accounts
4 Click Sample data 5. Click Apply
Correct Answer: C 🗳️
A business analyst uses the data manager to load customer data from a QVD file. The data manager automatically profiles the data, and recognizes City and Country values as Geo data.
The app must meet the following requirements;
* Country field should be in Geo data format
* City should NOT be allowed as a mapping option for the users
* There must be an association between the Country and City fields
Which actions should the business analyst take to meet these requirements?
- A. 1. In the Associations view, select the City field
2 Change the format from 'Geo data' to 'No data profiling' - B. 1. In the Associations view, select the City field
2 Delete Sgeoname-tag from field properties - C. 1 In the Associations view select the City field
2 Delete the City field - D. 1. In the Associations view, select the City field
2 Change the format from 'Geo data' to 'General'
Correct Answer: B 🗳️
A business analyst needs to make a complex pie chart easier to understand. The pie chart shows the total number of customers by customer type. There are 12 customer types. Some customers do NOT have a type assigned.
The business analyst needs to:
* Show all customers including those without a customer type
* See the total number of customers in each customer type
Which two visualizations could the business analyst use to meet these requirements? {Select two.)
- A. Bar chart
- B. Donut
- C. Scatter plot
- D. Treemap
- E. KPI
Correct Answer: A,C 🗳️
A client wants to see a bar chart with a single measure and three dimensions Region. Product Category, and Month The business analyst creates a tar chart with the measure. Sum(Revenue).
Which final step should the business analyst take to complete the chart?
- A. Create a cyclic group with Region, Product Category, and Month as dimensions
- B. Add Region, Product Category, and Month as three different dimensions
- C. Add Region as a dimension, add Product Category and Month as alternate dimensions
- D. Create a single master dimension with Region, Product Category, and Month
Correct Answer: D 🗳️
A business analyst has a QVD containing Sales, Manager. Date and Region The business analyst needs to quickly create a sheet with three visualizations Total Sales. Sales by Manager, and Sales by Date The sheet must allow for analysis by Region.
In the search bar, the analyst enters "Sales", "Manager", and "Date", and adds the objects to the sheet Which steps should the business analyst perform to finish creating the sheet?
- A. 1 Add two filter panes Sales and Manager
2 Drag and drop Sales from the Fields list onto the sheet
3 Add a line chart with Date as the dimension and Sales as the measure - B. 1. Add two filter panes: Region and Manager
2 Drag and drop Sales from the Fields list onto the sheet
3 Add a line chart with Date as the dimension and Sales as the measure - C. 1. Add two filter panes: Region and Sales
2 Drag and drop Manager from the Fields list onto the sheet
3 Add a line chart with Date as the dimension and Sales as the measure - D. 1 Add two filter panes: Date and Manager
2 Drag and drop Sales from the Fields list onto the sheet
3 Add a line chart with Manager as the dimension and Sales as the measure
Correct Answer: C 🗳️